

Following Fleury’s appreciation i’m a bad bad biologist, the worst he ever met, and probably vortex-blind, unable to see vortices where there are vortices.
In response to my request to point exactly at L2/R2 in his paper, he pointed to fig 6 of EPMAG supposedly depicting the four vortices. (vertically repositioned fig6 at the end of the post, per request of Fleury and with his authorization. But anyway, you do have access to the paper, as mentioned already, no need to use my space; for other pictures, get your blog Fleury, it’s the easiest way around)
First of all, let’s remind that what we are looking for (#, #, #, #) [this set of links, in fr], is a set of four vortices of cells, those supposed to induce limb buds extrusion. So, anything else that looks like such a vortex must be explicitly connected with the cells’ movements in the epiblast. On the other hand, Fleury’s model construction starts with two vortices (those usually observed), described in the introduction of EPMAG: It requires a huge cellular motion which has the shape of two vortices converging towards the posterior pole an[d] along the antero-posterior (AP).
So, the model is based on the presence of two vortices of cells, but four of them are expected to be visible at fig 6. So says Fleury here. That’s a serious mismatch we got here.
Fig 6’s legend is:
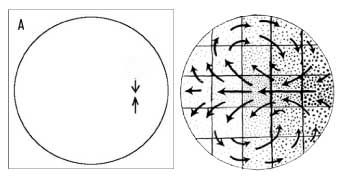
Figure 6. The stream lines with symmetrical forces, oriented face to face. These model the attractive (contractile) effect of Kohler’s sickle. (A) depicts schematically the situation. (B) shows the stream lines for two centers of forces (one on each side, top and bottom, located at -R/10 and +R/10). (C) shows the streamlines for six aligned centers of forces modeling Kohler’s sickle as a line of pulling agents (located at ±R/30, ±2R/30, ±R/10).
I suppose that there is a mistyping error for the the positioning of the pulling agents at (C), maybe it should read (located at ±R/30, ±2R/20, ±R/10), but that’s a detail.
(A) depicts the attractive effect of Kohler-Rauber sickle. It’s an oversimplification of cellular movements of epiblastic cells. As soon as 1929, Wetzel described these movements1, and recently time-lapse videos of GFP labeled epiblasts were produced, offering a useful tool for modeling them, including a crucial parameter, timing2.
Let’s compare (A) with Wetzel’s paper fig 91, p 278, as Weijer’s lab videos were produced after EPMAG‘s publication, depicting global cell movements in the epiblast before primitive streak formation.
Maybe i’m vortex-blind but there are people affected by cell-movements-diplopia. The two counter-rotating vortices are visible on Wetzel’s drawing, and were recently confirmed by Dirk Dormann and Cornelis J Weijer2.
The two are quite well correlated as one can see superposing Wetzel’s drawing to Weijer’s lab photos.
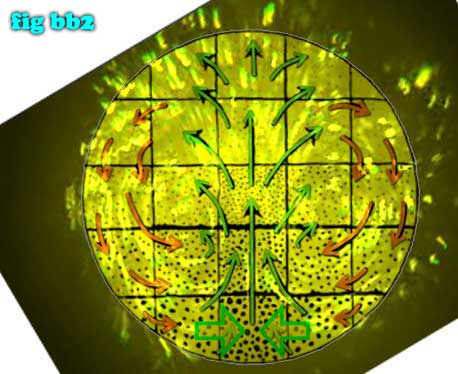
The image is composed by frame 47 of movie 11 of supplementary material of D Dormann and CJ Weijer2, fig 91 of Wetzel1 and fig6A of EPMAG, resized, rotated and adapted.
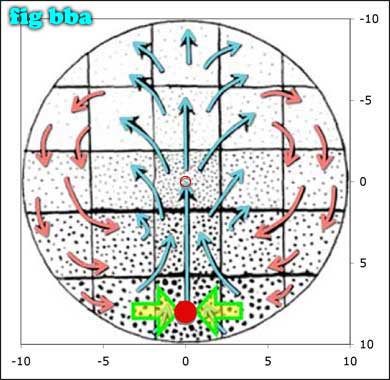
The correspondence between Wetzel drawing and direct observation of the cells movements in the epiblast is excellent. Arrows with a component along the AP axis oriented rostrally are colored « green », those oriented caudally « orange ». Fleury’s arrows from fig. 6A are represented by the two green empty arrows. (for position see below)
One can observe that there is a region near Kohler-Rauber sickle where vortexing cells doesn’t enter, the very same where Fleury placed the two arrows, not defined in the legend of fig6 more precisely than: (A) depicts schematically the situation. and in the text, p13, If there were only one force term, the “flow” would be as in Figure 5, since there are two forces, the flow is the superposition of two such “flow” maps, albeit with a little shift (Fig 6A). Again, this result is so far exact. The principle simplification is in the distribution of forces, which has been reduced to only two symmetrically pulling forces., so the two arrows must represent the two forces.
Well, IMO the principal simplification is unacceptable. Why, with the use of so comfy software as Mathematica one can easily map all the « stream lines » using directly Wetzel’s cell movements map. I suspect that the result would be quite different and that figures 6B and 6C are far far away from being exact and realistic, even assuming that there is such a thing as « stream lines » playing a role in gastrulation. Especially with no cells of those participating in the two vortices entering in the region where the two forces are placed.
By the way, in EPMAG, it isn’t explicitly presented that the KS was flattened for the exact calculation of the « stream lines »; which means the replacement of an approximatively 70° arc by a flat line and making coaxial movements of cells that aren’t:
If we add more source terms along Kohler’s sickle, for example, six force terms alined along Kohler’s sickle, we found a slightly modified deformation field, but almost indistinguishable (Fig. 6B)[? Fig. 6C i suppose]. (NB: Adding more terms to the description of Kohler’s sickle is analogous, in magnetism problems, to considering a coil made of several loops, instead of one single loop, or to replacing a single magnetic dipole by a magnetic needle of a certain length. One may think of a number of cells, or cell aggregates, pulling inside Kohler’s sickle: each of these cells can be treated as a single dipolar loop).
Except the deformation, what is quite disturbing in this description, is that while looking at actual cell movements in the epiblast (2, sup movie 11), there are no cells participating in the two vortices coming in KS! Each time they arrive at KS‘s level they turn and continue their movement toward the anterior pole. At least not before the formation of the PS, and afterwards, some point to, but don’t enter in KS. Well, that is probably another approximation, me, worst biologist evah, I don’t get. I expect that Fleury will kindly explain.
Let’s assume, for the discussion’s sake, that the potential tensions from cells movements could create such tensile forces (which should be proven), as those of figure 6A, and see what the relation between Fleury’s « stream lines » and cell movements could be. Fig6A isn’t very explicit about stage and positioning so I made the assumption that the two arrows point to Kohler-Rauber sickle (this isn’t clear in the text: « If this is true, then the center of the pattern in Figures 6 and 9 is Hensen’s node […] p15, c1, §1 | […]it then appears that Hensen’s node is actually the center of the contraction, which can be seen in (Fig. 6 or 9). p15, c2, §4« ) and the circle represents the external boundary of the ZO. An approximate positioning of the epiblast represented by an orange circle is proposed bellow:
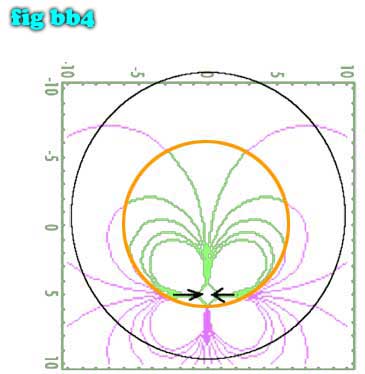
Inside « stream lines » are in green, outside « stream lines », over the ZO, in pink. It was supposed that my vortex-blindness made me incapable to see L2/R2, but in fact I was expecting to found them inside the epiblast. If L2/R2 are at the ZO area they aren’t positioned in a way that could relate them with the hind limbs buds, as Fleury asserts. And that’s the point trying to locate as much exactly as possible the two crypto-vortices L2/R2.
On the other hand, comparing bb4 and bb2 it’s easy to observe that there is no correlation between the « stream lines » and actual cells movements, neither in shape (except an overall oval resemblance) or positioning. To make it more clear:
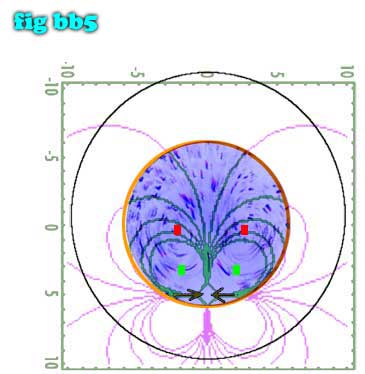
Red rectangles represent the centers of the two actual vortices, green ones those of Fleury’s « stream lines ». It may be another one of the approximations proposed by Fleury in which case there is nothing to be qualified as exact here, neither.
Maybe I faulty placed the epiblast (center at {~0, ~0} and ray ~5) and KS (at {~0, ~5}), in which case it would be kind from Fleury to indicate where he place them. To facilitate the exchanges, a representations with a rectangular coordinates set, similar to the one he used, but restricted to the epiblast.
I used Weltzer’s drawing as we know it fits nicely with direct images [bb2] and it was published largely before EPMAG.
And still, the connexion between the « stream lines » supposed to represent tensile stress and why cells would follow them (and maybe a visualization of cells following them), is not yet discussed.
Remember, i’m supposed to be the worst biologist evah.
All i ask for is to learn. By i do question every single bit of incoming information.
Let’s recapitulate:
- There is nothing connecting the « stream lines » of Fig 6B and 6C to cell movements, in the sense that the « stream lines » don’t represent cell trajectories but are rather calculated from cells trajectories.
- The « stream lines » pattern obtained considering only elements along the KS is an oversimplification letting aside the major part of cell movements in the epiblast.
- KS geometry was modified to fit a straight line and this modification isn’t explicit in the paper.
- Even if the « stream lines » have a physical reality equivalent, and could be somehow connected to cells’ trajectories, the presumed L2/R2 don’t lie over the epiblast and can’t be connected with hind limb budding.
I suspect that taking in account all the cell movements and conserving KS geometry will seriously change the « stream lines » pattern.
1 Wetzel, R. Untersuchungen am Hu ̈hnchen. Die Entwicklung des Keims während der ersten beiden Bruttage. Arch. EntwMech. Org. 119, 188–321 (1929).
2 Dirk Dormann and Cornelis J Weijer. Imaging of cell migration. The EMBO Journal 25, 3480–3493 (2006).
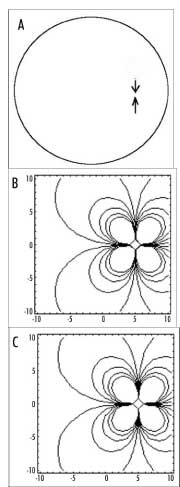 Figure 6. The stream lines with symmetrical forces, oriented face to face. These model the attractive (contractile) effect of Kohler’s sickle. (A) depicts schematically the situation. (B) shows the stream lines for two centers of forces (one on each side, top and bottom, located at -R/10 and +R/10). (C) shows the streamlines for six aligned centers of forces modeling Kohler’s sickle as a line of pulling agents (located at ±R/30, ±2R/30, ±R/10).
Filed under: post-it pour VF, vincent fleury | Tagged: cellular flows, epiblast, fleury, Kohler sickle, Kohler-Rauber sickle, primitive streak, Rauber sickle, stream lines, Weijer, Wetzel |

So ridiculous
You should stop, in your own interest, as stopped your friend Agathi.
I asked it several times, please just put the image from Chuai Weijer et al, the one with the saddle point, instead of fiddling around.
You are drowning
VF
I’m drowing, you don’t answer, that’s fine for me.
I asked it several times, please just put the image from Chuai Weijer et al, the one with the saddle point,
And I replied several times that you should have your personal website/blog to publish whatever you want. Easy to understand.
If you have difficulties, I offered help to start you up with that.
I presented Fig 6 and you avoid replying to:
a) There is nothing connecting the “stream lines” of Fig 6B and 6C to cell movements, in the sense that the “stream lines” don’t represent cell trajectories but are rather calculated from cells trajectories.
b) Even if the “stream lines” have a physical reality equivalent, and could be somehow connected to cells’ trajectories, the presumed L2/R2 don’t lie over the epiblast and can’t be connected with hind limb budding.
Why add more before you have reply to what is already posted?
Your error, considering the « stream lines » as cellular trajectories. Isn’t it?
And you know quite well that the figure you would like me to post don’t show four vortices! And we are looking for the L2/R2 cell vortices that would induce limbs budding, positioned in space and time in such manner that your hypothesis could be taken seriously.
Your extrapolations, you can keep them for you or whoever admit to built theories on hypothetical stuff.
Not even proven, just considered seriously. Further proof will be necessary to transform a correlation to a « causal phenomenon ».
« a) There is nothing connecting the “stream lines” of Fig 6B and 6C to cell movements, in the sense that the “stream lines” don’t represent cell trajectories but are rather calculated from cells trajectories. »
Oh dear, how « beeeeep »
« b) Even if the “stream lines” have a physical reality equivalent, and could be somehow connected to cells’ trajectories, the presumed L2/R2 don’t lie over the epiblast and can’t be connected with hind limb budding »
Oh dear, how « beeeeeeep ».
What a sweet non sense, you are really a total ignorant
Your readers certainly appreciate
Anyway, please just put the image I was talking about, an experimental evidence, it is in
Chuai M., Zeng W., Yang X., Boychenko V., Glazier J. A., Weijer C. J., Cell movement during chick primitive streak formation, Developmental Biology 296, 137–149 (2006).
figure 6, if i am not mistaken. That won’t take long for a smart blog wizard like you. A saddle point, on the epiblast. How do you call that kind of behaviour, let me remember , ah oui. « Scientific denialism »
you are very keen at it.
😀 That’s your discussion level?
“beeeeep”?
😀
Let’s put that on a main post, a little bit later this evening then. Hope Davies and Renault will visit someday 😉
you are laughning yourself into self- destruction.
That is so sad. You are a scientist, though, how come?
Why don’t you stop this nonsense?
[…] Following my post on EPMAG’s fig 6, Fleury, probably certainly unable to correctly discuss my objections, he offered the following responses: […]
You falsely claim that your theory is supported by peer reviewed publications, when it’s just an hypothesis presenting paper (I’m not the only one to think that apparently) and you think that I am challenging my reputation?
Are you kidding?
hey, what’s « laughning »?
a typo